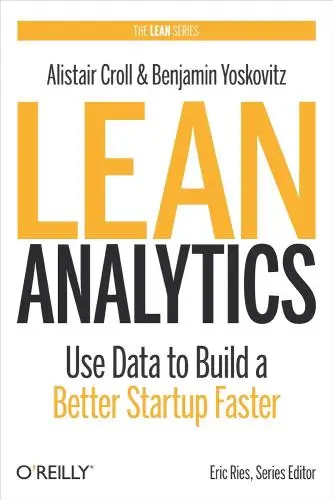
Lean Analytics
Use Data to Build a Better Startup Faster
What's it about?
Lean Analytics is a powerhouse guide that dives deep into the heart of startup success, focusing on the pivotal role of analytics. Alistair Croll masterfully demystifies how data-driven decisions can efficiently guide your business from idea to scale. Whether you're a budding entrepreneur or steering an established company, this book offers practical insights and actionable strategies to measure what truly matters, optimize your product, and navigate your path to growth with confidence. Lean Analytics is your roadmap to startup success, making it an indispensable resource in today's fast-paced business world.
About the Author
Alistair Croll is an author and entrepreneur specializing in technology, analytics, and business strategy. Notable for co-authoring "Lean Analytics," his work often explores the intersection of data, startup culture, and innovation, offering actionable insights. His writing style is clear, focused, and aimed at providing practical advice to readers.
10 Key Ideas of Lean Analytics
Identify and Focus on the One Metric That Matters (OMTM)
The concept of the One Metric That Matters (OMTM) is about narrowing your focus to a single metric that reflects the current, most important aspect of your business or project.
This approach simplifies decision-making and aligns team efforts towards achieving a specific goal.
The OMTM evolves as your business progresses through different stages, ensuring that you're always concentrating on the most critical aspect of growth or improvement.
By focusing on this singular metric, you can more effectively measure progress, make adjustments, and drive your business forward efficiently.
Learn DeeperIdentify Your Current Stage: Understand where your business or project currently stands. Are you in the early stages, focusing on user acquisition? Or are you optimizing for revenue? Identifying your stage will help you determine your OMTM.
Choose Your OMTM Wisely: Reflect on what metric, if improved, would have the most significant impact on your business right now. This could be user engagement, conversion rate, average order value, etc. Ensure it's measurable and directly influences your success.
Communicate Your OMTM to Your Team: Make sure everyone involved understands what the current OMTM is, why it's important, and how their work contributes to improving it. This alignment is crucial for collective effort and focus.
Regularly Review and Adjust Your OMTM: Set a regular schedule to review your OMTM. As your business evolves, so too will your key metric. Be prepared to shift your focus as needed to adapt to new challenges or opportunities.
- Example
For a new e-commerce website, the OMTM might be the conversion rate—the percentage of visitors who make a purchase. Focusing on optimizing the website design, simplifying the checkout process, or improving product descriptions could be strategies to improve this metric.
- Example
A mobile app in its early stages might focus on user retention as its OMTM. Strategies could include enhancing user onboarding, adding new features based on user feedback, or improving app performance to keep users engaged and reduce churn.
Leverage the Build-Measure-Learn Feedback Loop for Rapid Iteration
This tactic emphasizes the importance of building minimal viable products (MVPs), measuring their performance in the market, learning from the outcomes, and then iterating based on those learnings.
It's a cycle that promotes continuous improvement and agility, allowing businesses to quickly adapt to customer feedback and changing market conditions.
By consistently applying this loop, companies can avoid spending time and resources on features or products that don't meet market needs, thereby increasing the speed at which they can innovate and scale.
Learn DeeperStart Small: Begin by identifying the core feature or value proposition of your product. This is what you'll build as your MVP. Don't worry about making it perfect; focus on the essential functionality that solves a problem for your users.
Measure Effectively: Once your MVP is live, track how users interact with it. Use tools like Google Analytics for website interactions or in-app analytics for mobile applications. Pay attention to metrics that directly reflect the value your product offers, such as user engagement or conversion rates.
Learn and Iterate: Analyze the data you've collected to understand what's working and what's not. Look for patterns in user behavior that indicate satisfaction or points of friction. Use this insight to make informed decisions about what features to add, remove, or improve.
Repeat the Process: After making adjustments based on your learnings, go through the cycle again. Build updates or new features, measure their impact, learn from the results, and iterate. This ongoing process will help you refine your product and better meet your users' needs.
- Example
A startup launches a new app aimed at helping people track their daily water intake. Initially, they focus on the core feature: logging water consumption. After release, they notice that users frequently exit the app after logging their first drink. They hypothesize that users might be looking for more engagement or reminders. In the next iteration, they introduce hydration reminders throughout the day, which leads to increased user retention and engagement.
- Example
An online retailer introduces a recommendation engine to suggest products based on browsing history. Initially, the recommendations are based solely on the last item viewed. The retailer measures the click-through rate on recommended products and finds it lower than expected. They learn that users are more likely to click on recommendations that consider their entire browsing history, not just the last viewed item. The retailer then updates the recommendation algorithm to account for this, resulting in higher engagement and sales.
Understand and Utilize Different Types of Analytics for Holistic Insights
There are several types of analytics—each serving a unique purpose.
Descriptive analytics tells you what happened.
Diagnostic analytics helps you understand why it happened.
Predictive analytics forecasts what might happen in the future.
Prescriptive analytics suggests actions to achieve desired outcomes.
By understanding and utilizing these different types of analytics, businesses can gain a comprehensive view of their operations, market dynamics, and customer behavior.
This holistic approach enables more informed decision-making and strategic planning.
Learn DeeperIdentify Your Analytics Needs: Start by assessing which type of analytics will benefit your current situation the most. Are you trying to understand past performance, predict future trends, diagnose a problem, or decide on the next steps? This will guide you in choosing between descriptive, diagnostic, predictive, or prescriptive analytics.
Collect Relevant Data: Ensure you're collecting the right data for the type of analytics you need. For descriptive analytics, historical data is key. For diagnostic, you need data that shows correlations. Predictive analytics requires patterns over time, and prescriptive analytics needs data on potential outcomes of different decisions.
Use the Right Tools: There are various tools available for different types of analytics. Google Analytics is great for descriptive analytics, while tools like Tableau can help with diagnostic insights. For predictive analytics, consider machine learning platforms, and for prescriptive analytics, decision management software might be useful.
Apply Insights to Decision Making: Once you have your analytics, use them to make informed decisions. If your predictive analytics suggest a future trend, plan your strategy accordingly. If prescriptive analytics offers a course of action, evaluate its feasibility for your business.
- Example
A retail store uses descriptive analytics to review last quarter's sales data, identifying which products sold the most. They then apply diagnostic analytics to understand why these products were popular, perhaps due to a successful marketing campaign or seasonal demand.
- Example
An online service provider uses predictive analytics to forecast user growth in the next six months based on current trends. They then employ prescriptive analytics to outline specific marketing strategies and product improvements to ensure the predicted growth is met or exceeded.
Implement Continuous Deployment for Real-Time Learning
Continuous deployment involves automatically deploying every code change to a production environment after passing a series of tests.
This practice allows businesses to rapidly iterate on product development and immediately learn from real-world user interactions.
Continuous deployment accelerates the feedback loop, enabling quicker adjustments based on user feedback and performance data.
This approach not only speeds up product development cycles but also ensures that improvements are constantly being made in response to actual user needs.
Learn DeeperStart Small: Begin by automating the deployment of small, non-critical features. This helps you get comfortable with the process and tools without risking major disruptions.
Automate Testing: Invest in automated testing frameworks to ensure that every code change is thoroughly vetted before it's deployed. This reduces the risk of introducing bugs into the production environment.
Monitor Performance: Implement monitoring tools to track the performance of your application in real-time. This will help you quickly identify and rectify any issues caused by new deployments.
Gather User Feedback: Use surveys, analytics, and direct user feedback to understand how changes affect user experience. This information is crucial for guiding future development efforts.
Iterate Quickly: Based on the feedback and data collected, make quick adjustments to your product. The goal is to continuously improve and adapt to user needs.
- Example
A social media platform deploys a new feature that allows users to react to posts with emojis. They use continuous deployment to roll out the feature to a small percentage of users initially, monitor engagement and performance, and then adjust based on real-time feedback before a full rollout.
- Example
An e-commerce website introduces a recommendation engine to suggest products based on user browsing history. Through continuous deployment, they can quickly iterate on the algorithm, deploying updates daily based on user interactions and purchase data, optimizing for better recommendations over time.
Adopt the Pirate Metrics Framework (AARRR) for Growth Analysis
The AARRR framework stands for Acquisition, Activation, Retention, Referral, and Revenue.
It provides a structured approach to analyzing and optimizing each stage of the customer lifecycle.
By focusing on these five key metrics, businesses can identify bottlenecks, uncover opportunities for growth, and implement targeted strategies to improve overall performance.
This framework helps in understanding how users interact with your product and what drives them to convert, stay engaged, and become advocates for your brand.
Learn DeeperIdentify Your Acquisition Channels: Start by pinpointing where your customers are coming from. Is it social media, word of mouth, or paid ads? Focus on the channels that bring in the most engaged users.
Optimize Activation: Make the first experience with your product unforgettable. Simplify sign-up processes, offer tutorials, or provide immediate value to ensure new users understand and enjoy your product.
Track and Improve Retention: Use analytics to find out when and why users drop off. Implement features or content that keeps them coming back, such as personalized emails, rewards for frequent use, or regular updates.
Encourage Referrals: Make it easy and rewarding for your current users to refer others. This could be through a referral program that offers benefits to both the referrer and the referee.
Maximize Revenue Opportunities: Understand what makes your users willing to pay and how much. Experiment with different pricing models, upsells, or premium features to increase your revenue.
- Example
A fitness app uses social media as its primary acquisition channel. By analyzing their data, they find Instagram stories drive the most sign-ups. They then double down on creating engaging stories to attract more users.
- Example
An online learning platform notices a drop in user engagement after the first month. They implement a 'streak' feature, rewarding users with badges and discounts for consecutive days of learning, significantly improving retention rates.
Deeper knowledge. Personal growth. Unlocked.
Unlock this book's key ideas and 15M+ more. Learn with quick, impactful summaries.
Read Full SummarySign up and read for free!
Lean Analytics Summary: Common Questions
"Ideas are cheap; execution is everything." This quote from Lean Analytics by Alistair Croll encapsulates the essence of the book, which delves into the importance of measuring metrics that matter to drive successful business growth. The book emphasizes the concept of "One Metric That Matters" (OMTM) to help businesses focus on the key metric that directly impacts their success.
What truly grabbed my attention was the practical examples and case studies provided throughout the book, illustrating how companies like Dropbox effectively used analytics to drive their decision-making processes. However, at times, the complexity of certain analytical concepts left me a bit perplexed, requiring me to re-read some sections for better understanding.
Overall, Lean Analytics is a highly insightful read for anyone looking to leverage data-driven strategies for business success. If you enjoyed books like "The Lean Startup" by Eric Ries, this book will be right up your alley.
Experience Personalized Book Summaries, Today!
Discover a new way to gain knowledge, and save time.
Sign up for our 7-day trial now.
No Credit Card Needed
Similar Books

$100M Offers
Alex Hormozi
Principles of Marketing, Global Edition
Gary Armstrong
The 100 Best Business Books of All Time
Jack Covert
Playing to Win
A.G. Lafley
Productize
Eisha Armstrong
Start Your Own Pet-Sitting Business and More
Entrepreneur Press
The 22 Immutable Laws of Marketing
Al Ries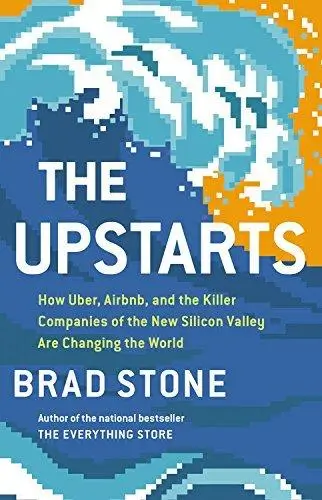
The Upstarts
Brad Stone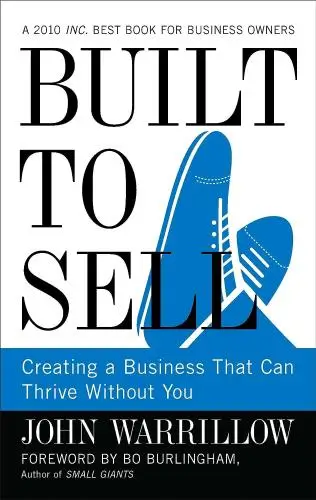
Built to Sell
John Warrillow
Traction
Gabriel WeinbergTrending Summaries

Peak
Anders Ericsson
Never Split the Difference
Chris Voss
Smart Brevity
Jim VandeHei
The Psychology of Money
Morgan Housel
The First 90 Days
Michael D. Watkins
Atomic Habits
James Clear
Thinking, Fast and Slow
Daniel Kahneman
The Body Keeps the Score
Bessel van der Kolk M.D.
The Power of Regret
Daniel H. Pink
The Compound Effect
Darren HardyNew Books

The White Night of St. Petersburg
Michel (Prince of Greece)
Demystifying Climate Models
Andrew Gettelman
The Hobbit
J.R.R. Tolkien
The Decision Book
Mikael Krogerus
The Decision Book: 50 Models for Strategic Thinking
Mikael Krogerus
Fichte
Johann Gottlieb Fichte
Do No Harm
Henry Marsh
This is Going to Hurt
Adam Kay
This Is Your Brain on Joy
Earl Henslin
